What has happened to Medicare’s Spending on Prosthetics since 2010?
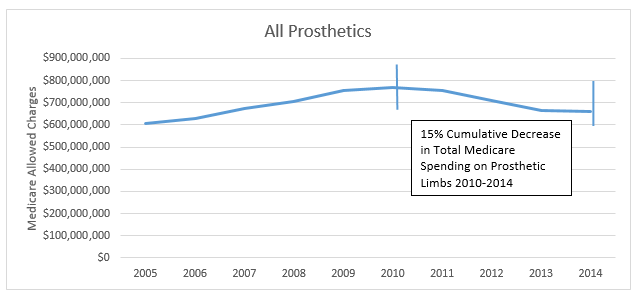
AOPA has analyzed the data, and the picture is clear. Medicare spent 15% less in 2014 than in 2010 on prosthetics.
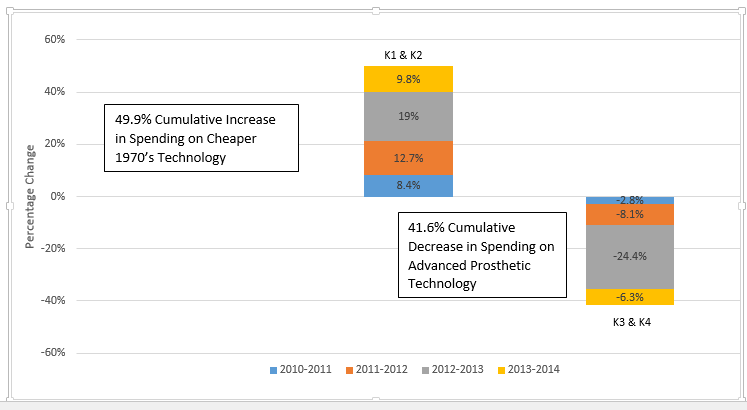
Medicare spending on advanced prosthetics has trended down 41%, while spending on older technologies has trended up almost 50%. Overall spending has decreased by 15% since 2010.
| Year | All Prosthetic Spending | Year | All Prosthetic Spending |
| 2005 | $607,797,189 | 2010 | $770,462,739 |
| 2006 | $628,220,869 | 2011 | $756,265,554 |
| 2007 | $676,421,628 | 2012 | $710,599,456 |
| 2008 | $704,604,327 | 2013 | $664,405,441 |
| 2009 | $753,410,033 | 2014 | $662,585,471 |
Medicare Spending has INCREASED on antiquated prosthetics and DECREASED on Newer Technologies.

| 2010 | 2011 | 2012 | 2013 | 2014 | Total % Change 2010-2014 | |
| K3 & K4 Feet | $90,386,136 | $87,863,510 | $80,780,898 | $61,078,042 | $57,205,529 | -41.6% |
| K1 & K2 Feet | $3,123,856 | $3,385,101 | $3,815,199 | $4,540,293 | $4,98,3348 | 49.9% |


